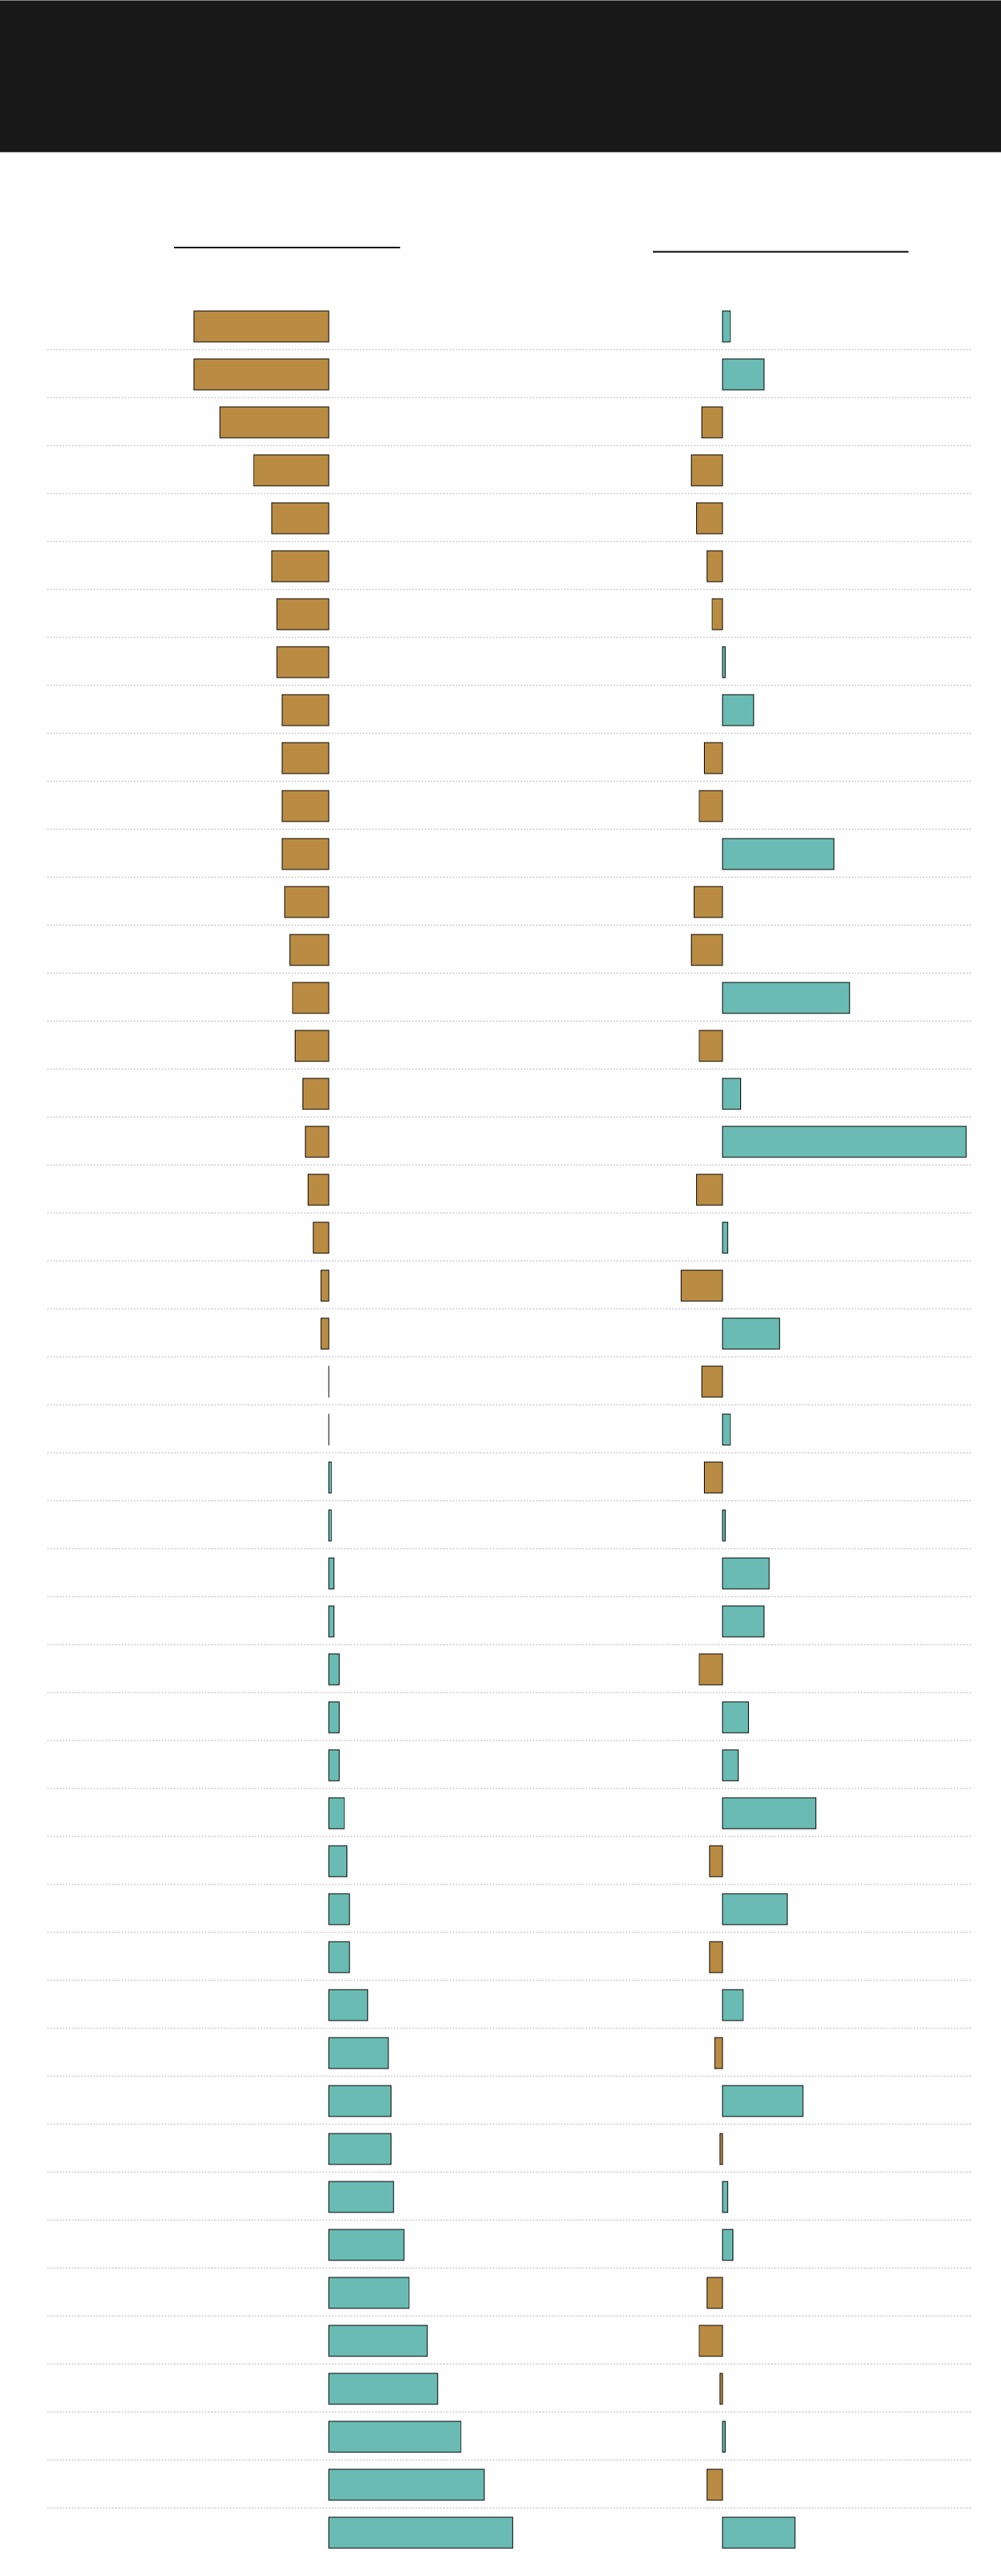
Many coastal states, with some of the highest costs of living,
pay providers at or below the median rate of $82
Rate Medicaid pays to psychologists for 45 minutes of therapy
Percent change from the the national median cost of living score
low
median
high
low
high
median
+12
$67
+12
$67
$39
+16
$39
+16
+1
$124
+1
$124
−1
$102
−1
$102
+1
$83
+1
$83
+18
$84
+18
$84
+31
$102
+31
$102
+3
$82
+3
$82
−3
$101
$70
−3
$101
+36
+49
$70
$87
+36
+2
$77
+49
$87
+2
$77
−8
$48
−8
−5
$48
$87
−5
$87
$84
$84
+3
$39
−10
$75
+3
$39
−10
$75
+16
−6
$131
+16
−6
$131
+7
$74
+7
$74
+25
−8
$82
$88
+25
−8
$82
$88
+8
−5
$88
+8
−5
−9
$88
$67
−9
$67
−1
$117
−1
$117
−9
$71
−9
$71
+6
$85
+6
$85
+2
+2
+43
$67
$103
+43
$67
$103
−13
−13
−10
$64
−10
$64
−6
$64
−6
$64
−4
$66
−4
$66
−11
−11
−12
$70
−12
$70
+4
$106
+4
$106
−9
$85
−9
$85
−9
$113
−6
$107
−9
$113
−6
$107
−11
$68
−11
$68
−12
$58
−16
$80
−12
$58
−16
$80
−7
$67
−7
$67
−7
$83
−7
$83
+1
$65
+1
$65
+28
+28
$140
$140
$75
+94
$75
+94
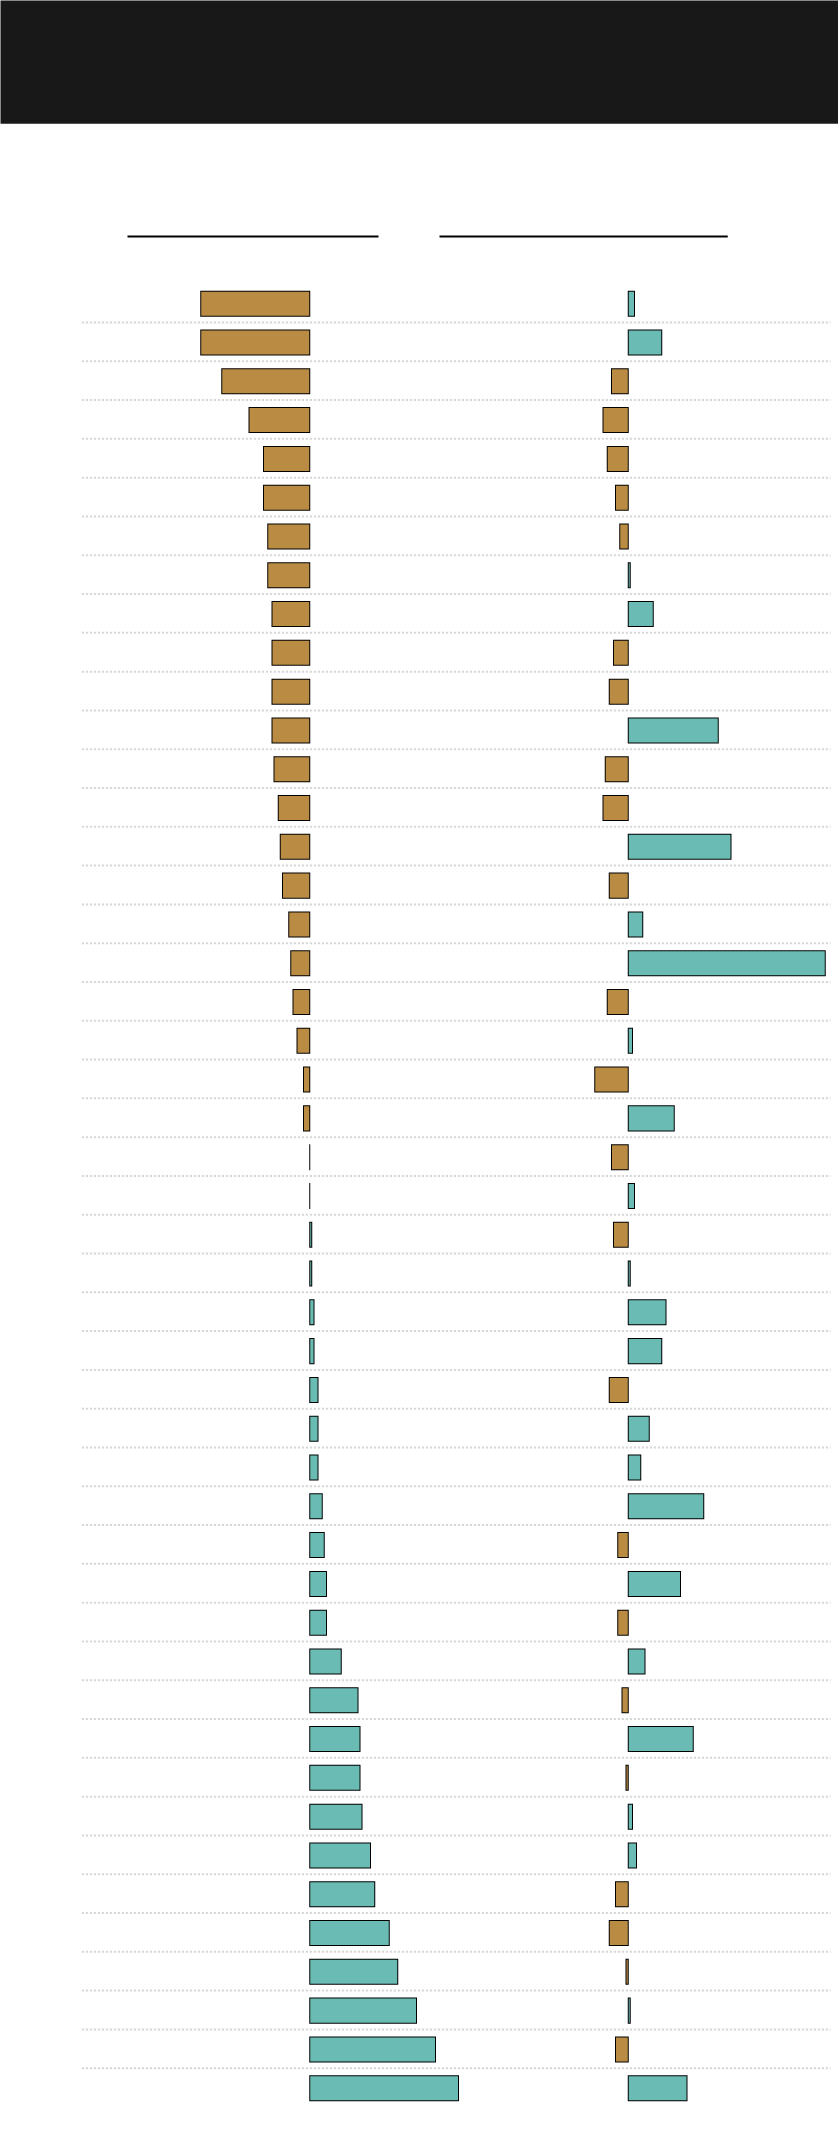
Many coastal states, with some of the
highest living costs, pay providers at
or below the median rate of $82
Rate Medicaid pays to psychologists for
45 minutes of therapy
low
median
high
$67
$67
$39
$39
$124
$124
$102
$102
$83
$83
$84
$84
$102
$102
$82
$70
$82
$70
$101
$101
$87
$77
$87
$77
$48
$48
$87
$87
$84
$84
$39
$75
$39
$75
$131
$131
$74
$74
$82
$88
$82
$88
$88
$88
$67
$67
$117
$117
$71
$71
$85
$85
$103
$103
$67
$67
$64
$64
$64
$64
$66
$66
$70
$70
$106
$106
$85
$85
$113
$107
$113
$107
$68
$68
$58
$58
$80
$80
$67
$67
$83
$83
$140
$140
$65
$65
$75
$75
Percent change from the the national median
cost of living score
low
median
high
+12
+12
+16
+16
+1
+1
−1
−1
+1
+1
+18
+18
+31
+31
+3
+49
+3
+49
−3
−3
+36
+2
+36
+2
−8
−8
−5
−5
+16
+16
+3
−10
+3
−10
−6
−6
+7
+7
−8
+25
−8
+25
+8
−5
+8
−5
−9
−9
−1
−1
−9
−9
+6
+6
+2
+2
+43
+43
−13
−13
−10
−10
−6
−6
−4
−4
−11
−11
−12
−12
+4
+4
−9
−9
−9
−6
−9
−6
−11
−11
−12
−12
-16
-16
−7
−7
−7
−7
+28
+28
+1
+1
+94
+94

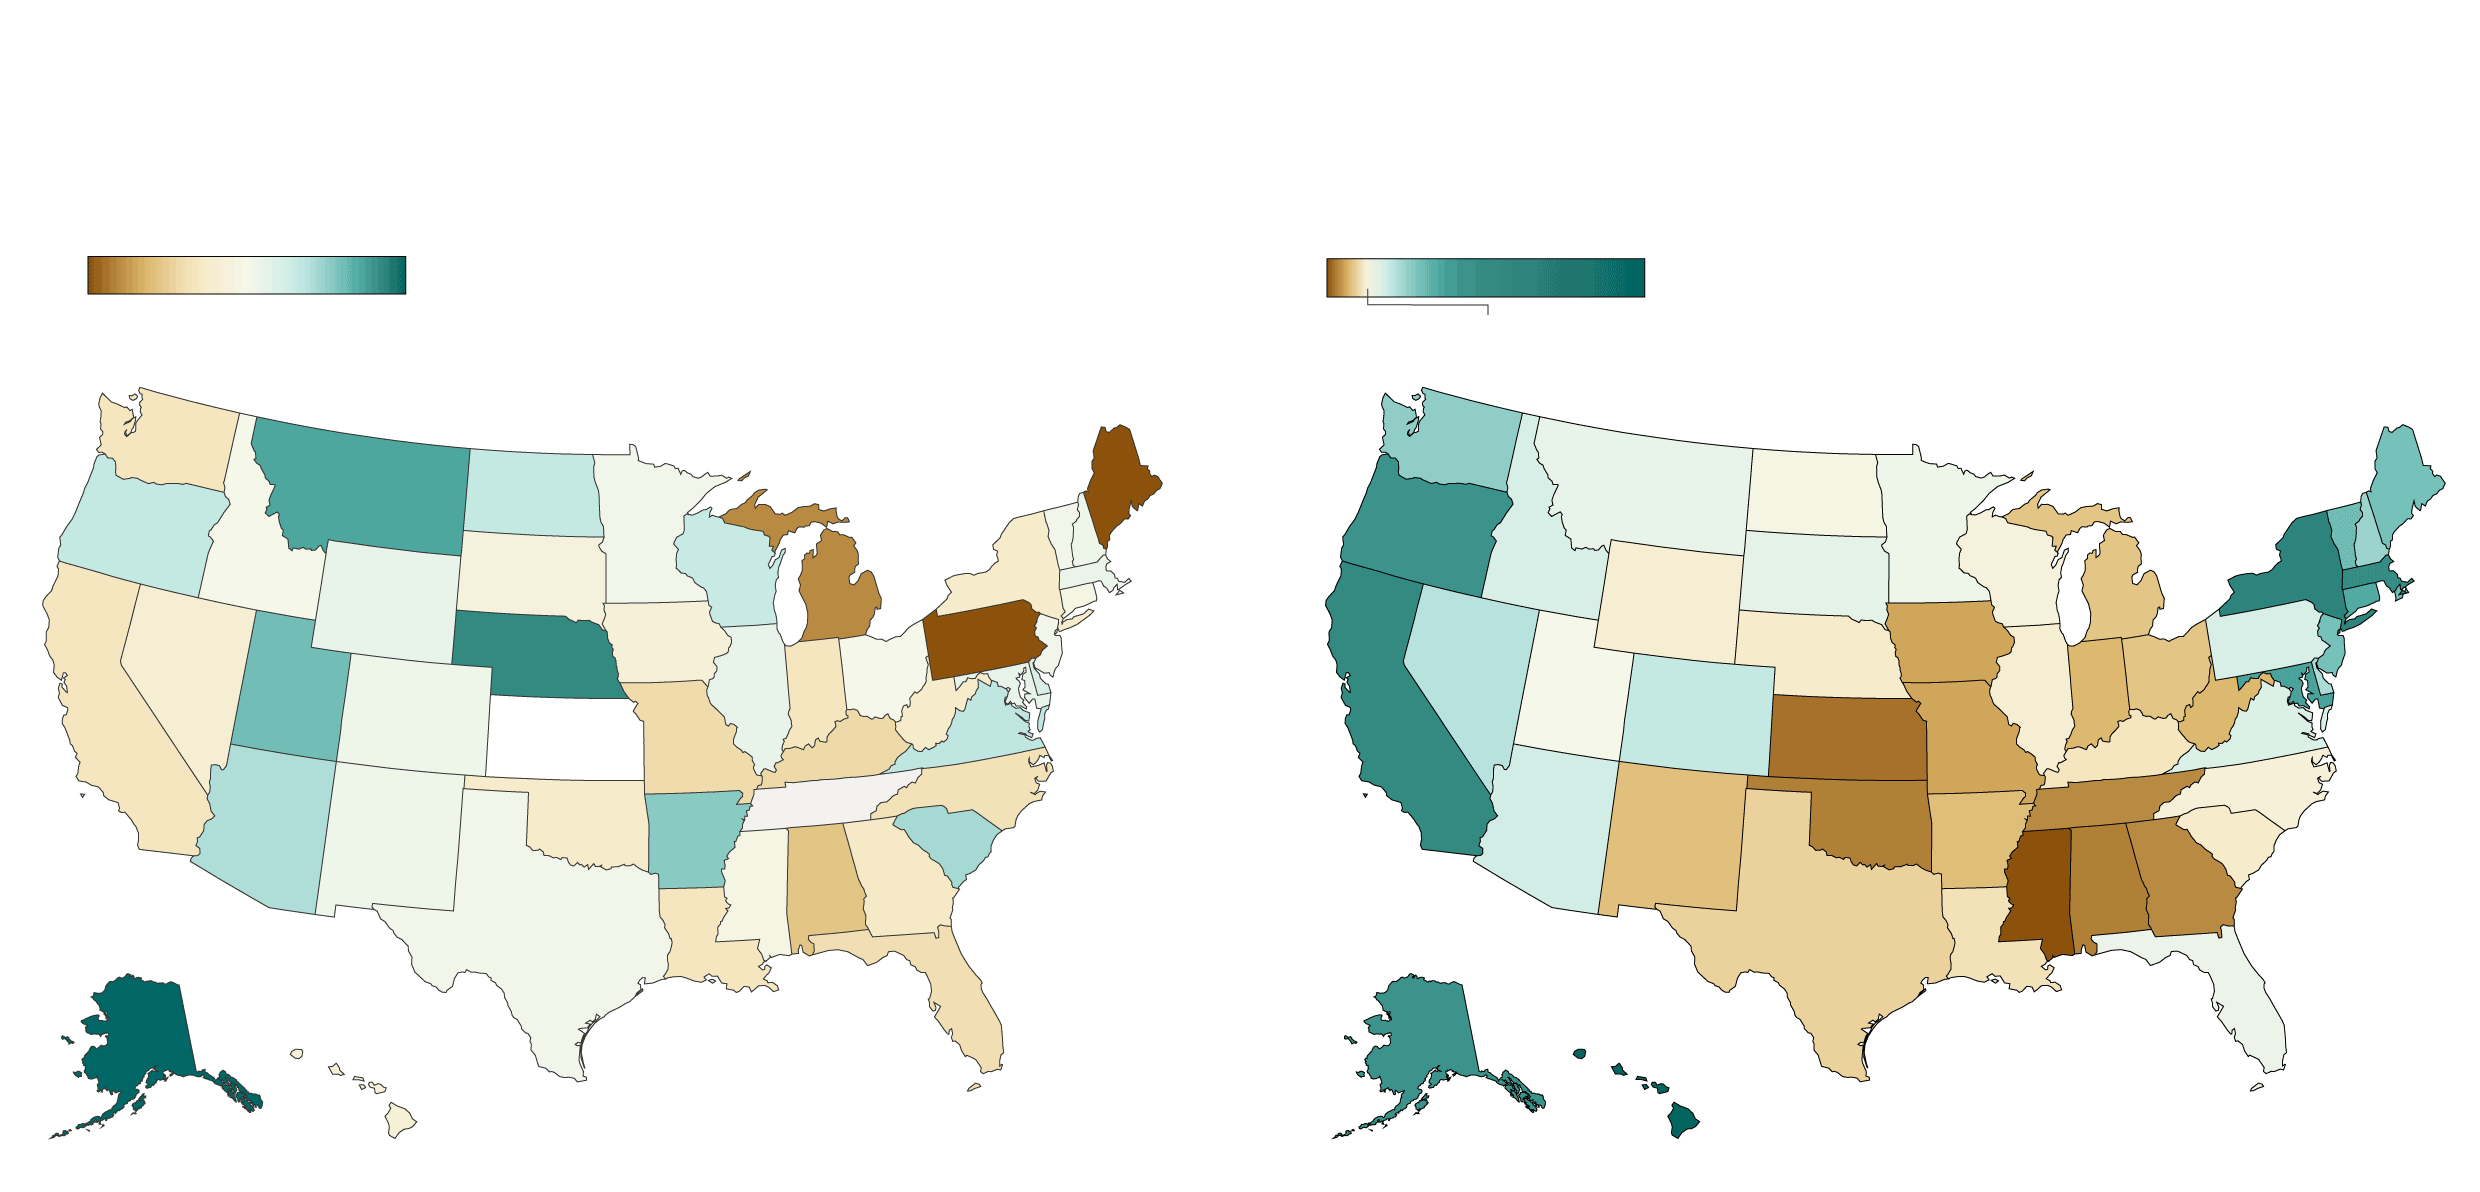
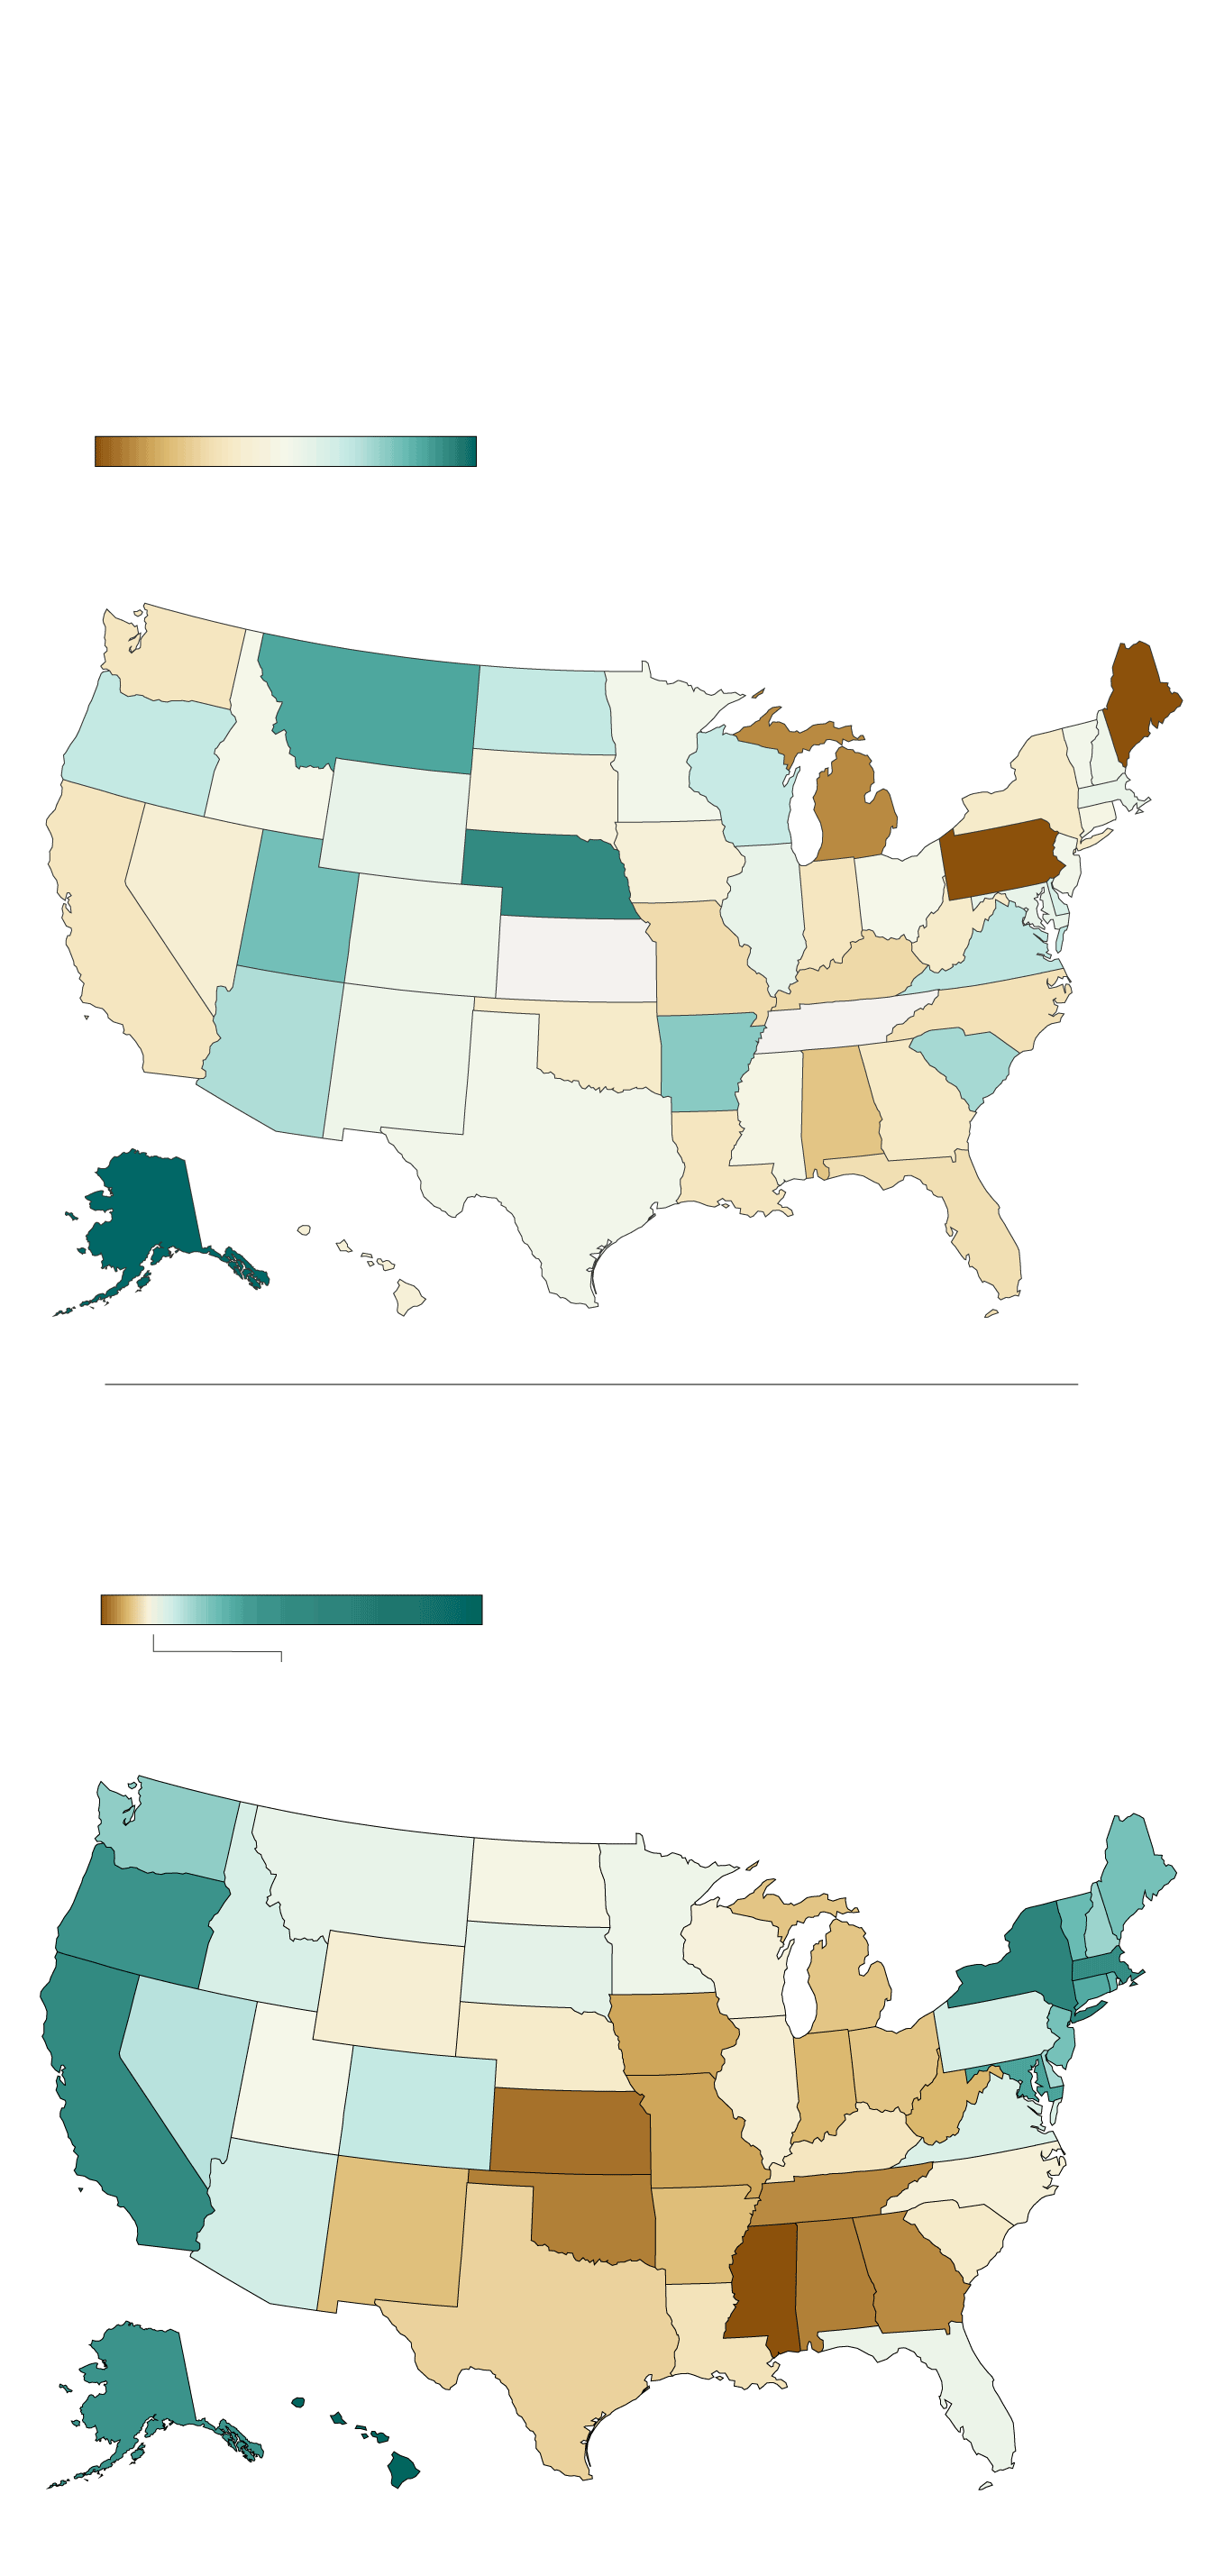
Many coastal states, with some of the
highest living costs, pay providers at
or below the median rate of $82
Rate Medicaid pays to psychologists for
45 minutes of therapy
low
median
high
$67
$67
$39
$39
$124
$102
$124
$102
$83
$83
$84
$102
$84
$102
$82
$70
$82
$70
$101
$101
$87
$77
$87
$77
$48
$87
$48
$87
$84
$84
$39
$75
$39
$75
$131
$131
$74
$74
$82
$88
$82
$88
$88
$67
$88
$67
$117
$117
$71
$71
$85
$85
$103
$103
$67
$67
$64
$64
$64
$64
$66
$66
$70
$70
$106
$106
$85
$113
$107
$85
$113
$107
$68
$58
$68
$80
$58
$80
$67
$67
$83
$83
$140
$140
$65
$65
$75
$75
Percent change from the the national median
cost of living score
low
median
high
+12
+12
+16
+16
+1
−1
+1
−1
+1
+1
+18
+31
+18
+31
+3
+49
+3
+49
−3
−3
+36
+2
+36
+2
−8
−5
−8
−5
+16
+16
+3
−10
+3
−10
−6
−6
+7
+7
−8
+25
−8
+25
+8
−5
−9
+8
−5
−9
−1
−1
−9
−9
+6
+6
+2
+2
+43
+43
−13
−10
−13
−10
−6
−6
−4
−4
−11
−11
−12
−12
+4
+4
−9
−9
−6
−9
−9
−6
−11
−12
−11
−12
-16
-16
−7
−7
−7
−7
+28
+28
+1
+1
+94
+94